

Dale St. Marthe
Use the WebAudio panel to view the WebAudio API metrics.
Overview
The WebAudio panel shows the AudioContext performance metrics for websites that use the WebAudio API.
Open the WebAudio panel
To open the WebAudio panel:
- Open DevTools.
- Open the Command menu by pressing:
- macOS: Command+Shift+P
- Windows, Linux, ChromeOS: Control+Shift+P
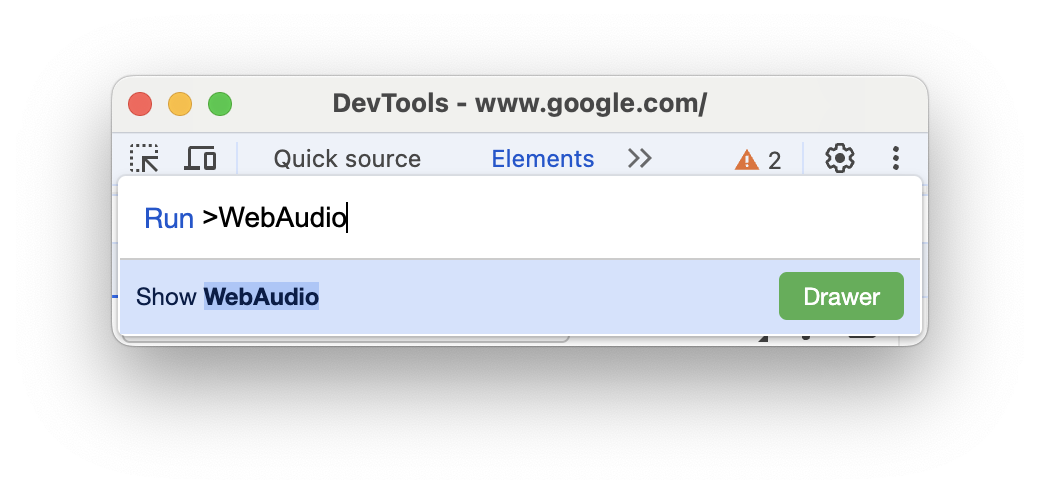
- Start typing
WebAudio, select Show WebAudio, and press Enter. DevTools displays the WebAudio panel at the bottom of your DevTools window.
Alternatively, in the top right corner, select more_vert More options > More tools > WebAudio.
View the AudioContext metrics
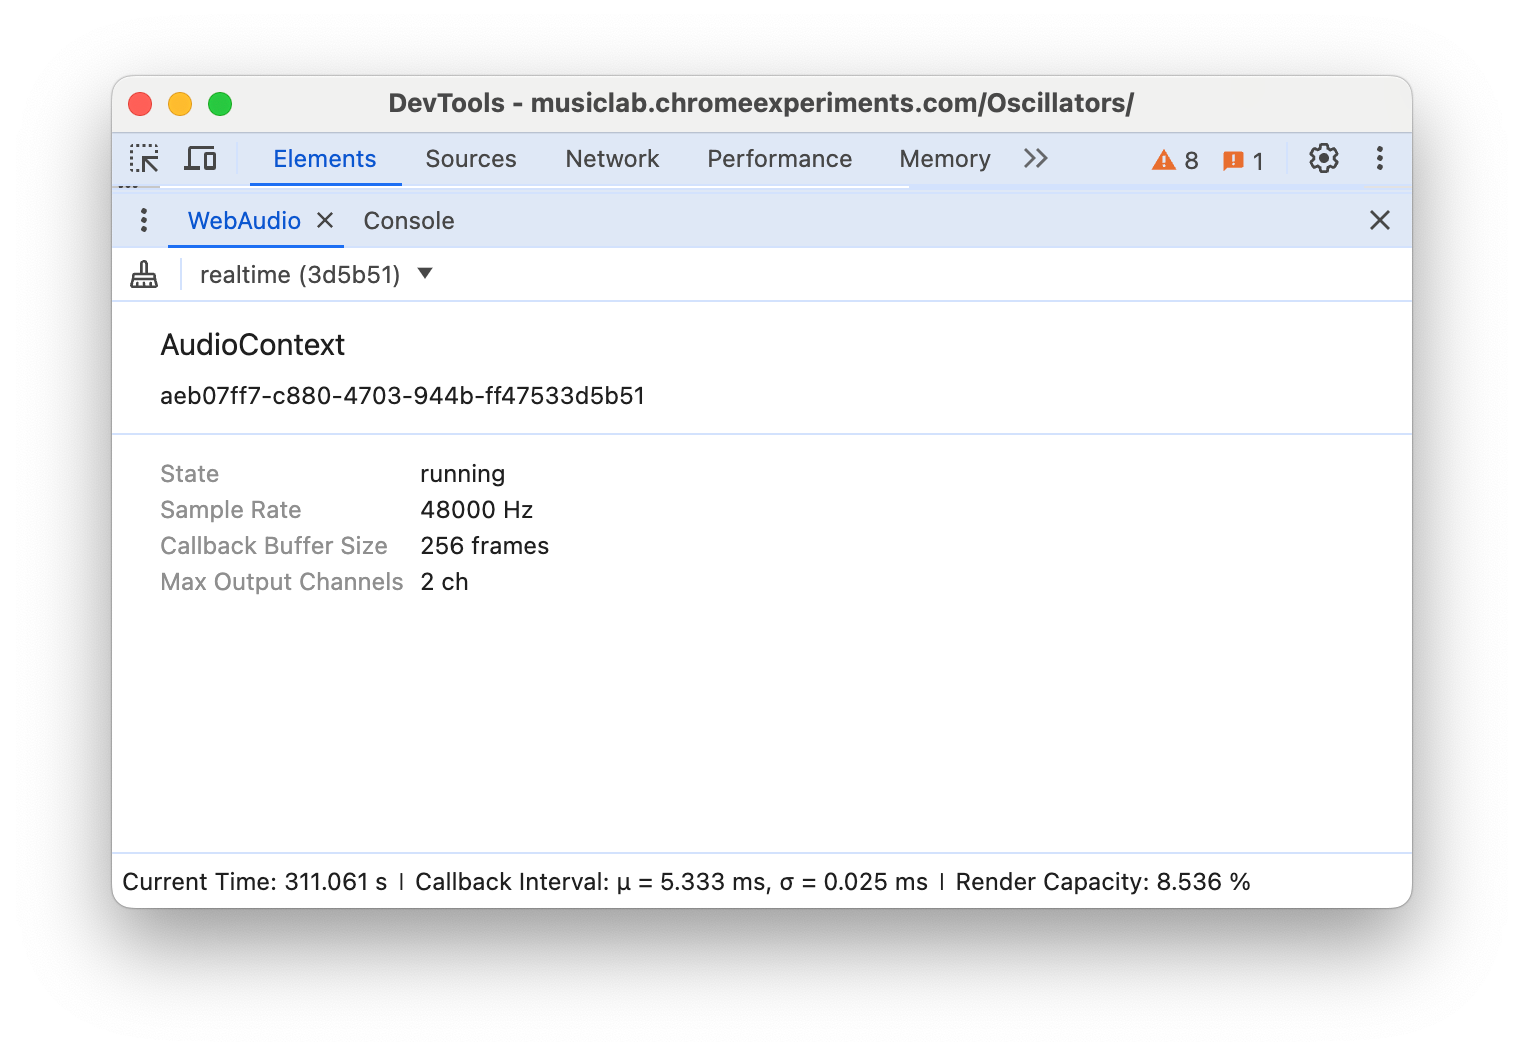
In the action bar at the top of the WebAudio panel, select the AudioContext to see the following metrics for:
- State: Indicates the state of the current audio context. Can either be
closed,running, orsuspended. - Sample Rate (Hz): The sampling rate per second as reported from AudioContext, converted to hertz.
- Callback Buffer Size (frames): The audio callback buffer size, specified in sample frames, provided by the underlying system.
- Max Output channels (ch): The maximum number of audio channels available on the current audio output device.
And, in the status bar at the bottom:
- Current Time (s): A current timestamp in seconds reported from the AudioContext.
- Callback Interval (ms): The weighted average variance of time between callbacks.
- Render Capacity (percent): A percentage indicating how the web audio renderer is performing over a given render budget.
To collect garbage, click the corresponding mop button in the action bar.